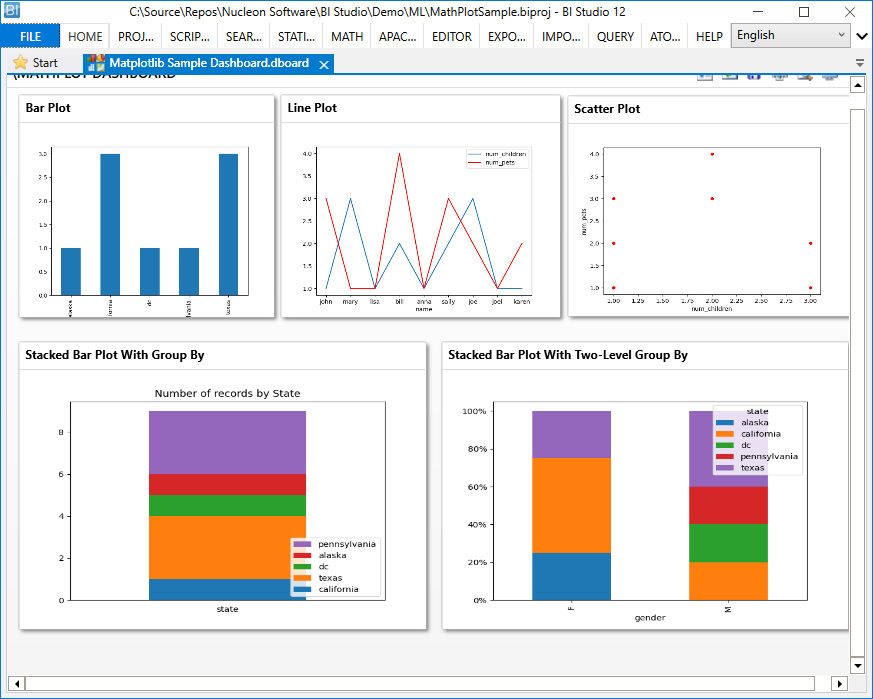
Nucleon BI – Plot Examples with Matplotlib and Pyplot
Matplotlib is easy to use and an amazing visualizing library in Python. It is built on NumPy arrays and designed to work with the broader SciPy stack and consists of several plots like line, bar, scatter, histogram, etc.
The following sample BI project provides Python MatPlotLib plotting examples and dashboards. The data for plotting is stored in the project file.
References:
https://queirozf.com/entries/pandas-dataframe-plot-examples-with-matplotlib-pyplot
https://www.geeksforgeeks.org/matplotlib-tutorial
Sample Project:


