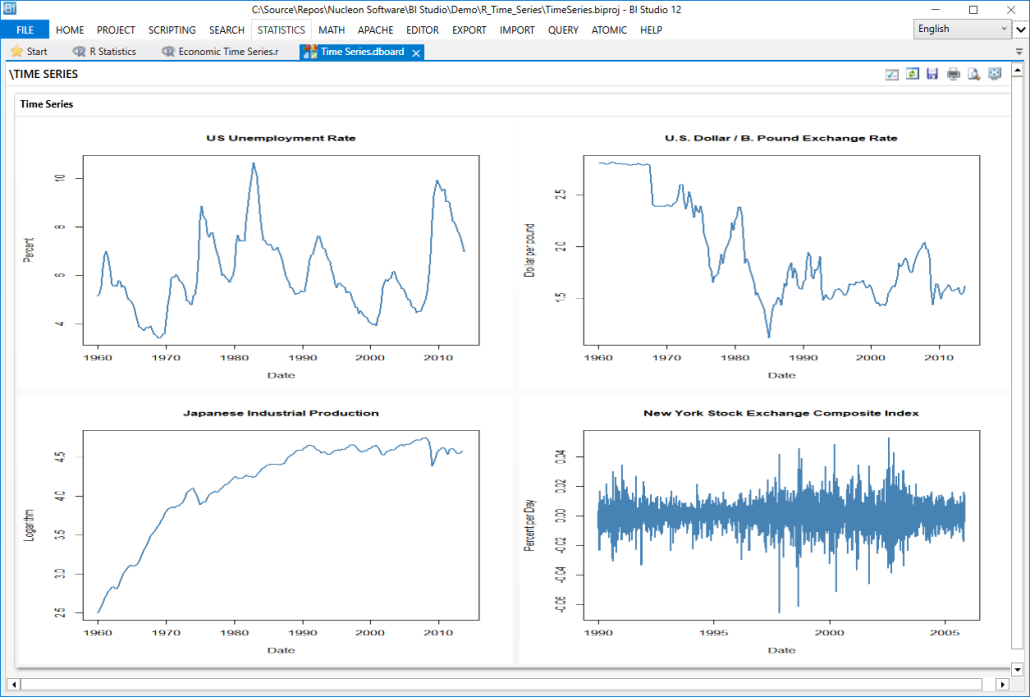
Time Series Data and Serial Correlation Sample
GDP is commonly defined as the value of goods and services produced over a given time period. The data set us_macro_quarterly.xlsx is provided by the authors and can be downloaded here. It provides quarterly data on U.S. real (i.e. inflation adjusted) GDP from 1947 to 2004.
As before, a good starting point is to plot the data. The package quantmod provides some convenient functions for plotting and computing with time series data. We also load the package readxl to read the data into R..
For full article: 14.2 Time Series Data and Serial Correlation | Introduction to Econometrics with R (econometrics-with-r.org)
Download Sample BI Project: R_Time_Series.zip

