Design BI Dashboards Using AI and Single Web Page in Minutes
This project highlights the development of an Executive Market Dashboard built within the Nucleon BI Studio ecosystem. The objective was to convert raw, unstructured data into a streamlined decision-support layer through advanced visualization techniques and dynamic client-side filtering.
By combining structured data binding with interactive front-end logic, the solution enables leadership teams to move beyond passive reporting and toward real-time, insight-driven decision making.
Accelerating Development: My AI-Assisted Workflow
Building a sophisticated dashboard traditionally requires extensive coding, particularly when dealing with responsive CSS structures and complex JavaScript logic. In this project, Generative AI was used as a technical co-pilot to accelerate the development cycle within Nucleon BI Studio.
Below is an overview of the prompt engineering approach that shaped the core architecture of the solution.
Step 1: Creating the Single Web Page ( SPA)
Provide your database structure and ask the AI to generate a clean, executive-level Single Page Application (SPA) that includes HTML, JavaScript, and data, all in one page.
Step 2: Binding the Data
After creating an SPA page, you need to bind data from your sources to the page. You can bind the data as follows:
 const marketDataArray =
    [

        {
          label: "{Field="Date"}",     // original display label
          price: {Field="Close_Price"},         // number
          volume: {Field="Volume"},             // number
          ret: {Field="Daily_Return_Pct"},                // number (Return %)
          vola: {Field="Volatility_Range"}            // number (Volatility)
        },

    ];
The most critical requirement was the Dynamic Date Filter. Since Nucleon BI Studio handles the data binding, I needed a JavaScript layer to parse that data and filter it on the client side without refreshing the page.
Step 3: Refinement & Error Handling
To ensure the dashboard was production-ready, I focused on robustness—handling edge cases like missing data or invalid date formats.
By clearly defining the context (Nucleon BI Studio environment), the expected output (executive-level dashboard), and the functional logic (client-side filtering and dynamic binding), the development process moved from concept to a fully functional prototype in a fraction of traditional development time.
DOWNLOAD
https://nucleonsoftware.com/store/MarketTrendExternal.zip
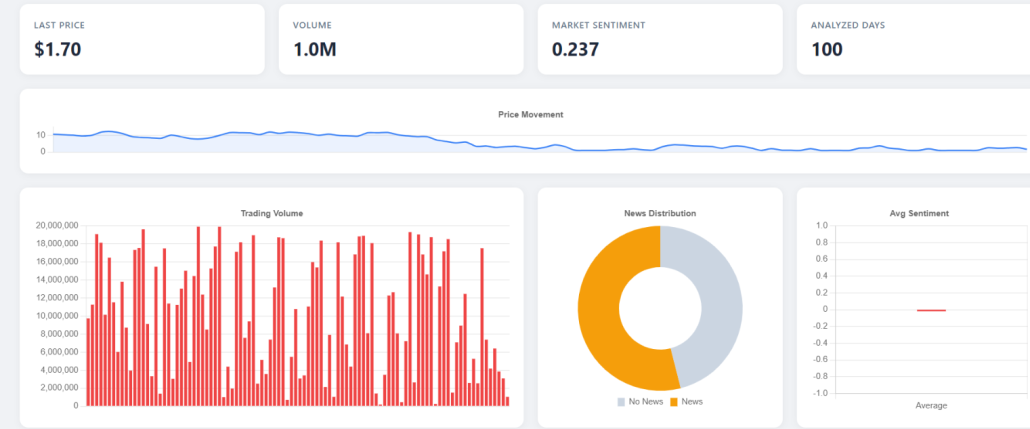
Sample Dashboards
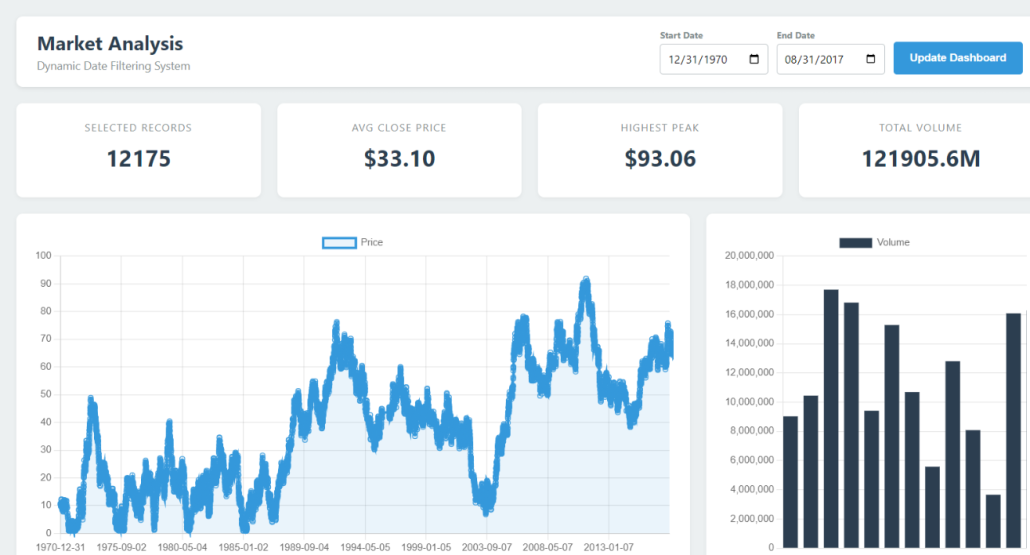
Figure 2: Market Analysis Dashboard
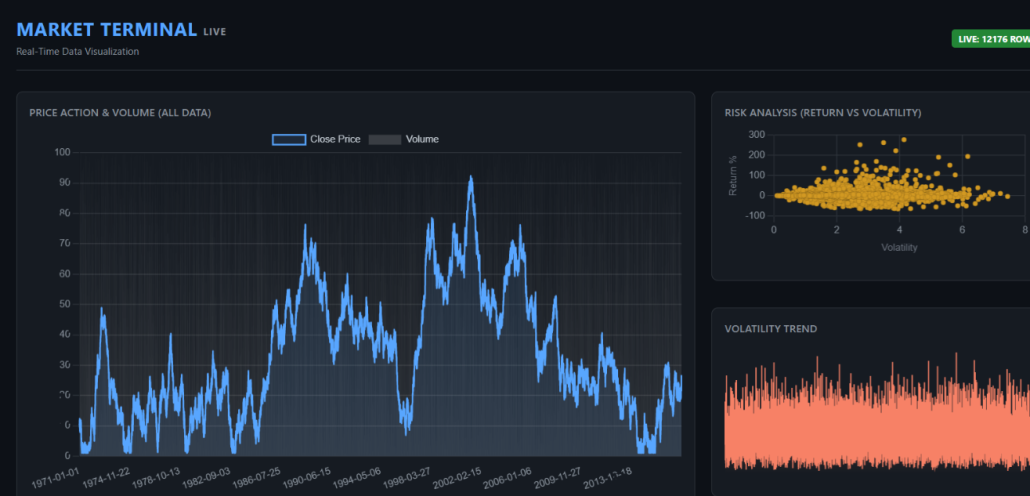
Figure 3: Market Terminal Dashboard