Healthcare Data Analytics: Building Interactive Dashboards with Python Script
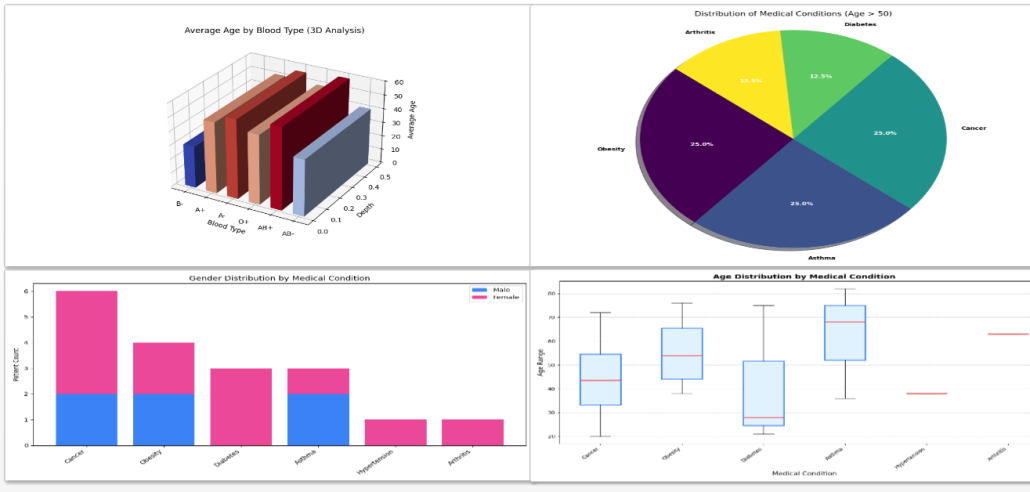
Figure 1: Clinical & Demographic Insights
The ability to extract meaningful patterns from healthcare data plays a central role in modern clinical management. This project presents the development of an integrated analytics environment in which Python scripting functions as the core engine for advanced data processing and transformation.
Built on Nucleon BI Studio as the primary business intelligence platform, the solution moves beyond traditional static reporting and enables a dynamic, multi-layered analytical framework. Instead of relying solely on predefined BI configurations, the architecture allows direct interaction between Python scripts and raw datasets, creating a more flexible and scalable analytical ecosystem.
The project introduces two specialized dashboards designed to strengthen both clinical and operational oversight. The first dashboard focuses on patient demographics and age-based clinical distributions, incorporating 3D visualizations to improve interpretability and depth perception. The second dashboard expands the analysis into hospital finance metrics and gender-based condition correlations. Together, these dashboards demonstrate how programmable analytics can transform fragmented healthcare records into structured, decision-ready intelligence.
The analytical workflow begins with structured data acquisition. Healthcare records are securely injected into the Python environment using the native dataset integration syntax of Nucleon BI Studio. By leveraging Python’s built-in CSV handling mechanisms, the system dynamically interprets column structures and naming conventions, ensuring resilience against inconsistencies such as header formatting variations. This approach reduces preprocessing complexity while maintaining pipeline stability.
with open('{healthcare_dataset|format=csv}', 'r') as rcsvfile:
    reader = csv.DictReader(rcsvfile)
    headers = reader.fieldnames
    # Dynamic key mapping for robust data fetching
    age_key = next((h for h in headers if h.strip().lower() == 'age'), 'Age')
Following ingestion, the dataset undergoes layered analytical processing. Demographic indicators, condition-based distributions, and grouped statistical evaluations are computed using optimized data structures. For example, calculating average patient age segmented by blood type or identifying condition frequency across age groups requires real-time aggregation logic. Python’s native data handling capabilities enable these computations to be performed efficiently while preserving readability and extensibility.
The final phase centers on structured output generation. Visualizations are programmatically rendered and exported in high-resolution formats to ensure seamless integration into dashboards, executive reports, and web-based interfaces. Automating this stage guarantees consistency between analytical results and their presentation, minimizing manual intervention and reducing reporting discrepancies.
Overall, the implementation represents a transition toward a programmable intelligence framework within Nucleon BI Studio. By combining Python’s analytical flexibility with business intelligence infrastructure, the project establishes a scalable foundation for advanced healthcare data analysis and decision support.
DOWNLOADS:
https://nucleonsoftware.com/store/HealthcareClassification.zip
Sample Dashboards
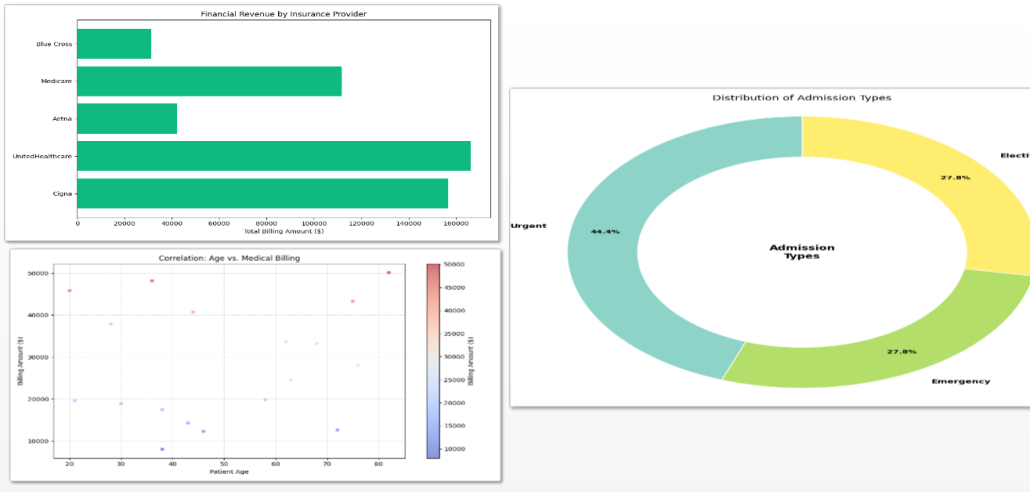
Figure 2: Operational & Financial Performance Dashboard