Nucleon BizApp Studio
Nucleon BizApp Studio is an high level application design and development software without or less coding. It supports data editor forms, user controls, reports, charts, tables, chross tables, scripting and other application components.
Editor Forms
Data Forms are allows you to CRUD (create, edit, update, delete), search and view data using HTML based editor forms. It provides form designer and viewer where you can design data editor form with its data editor controls (textbox, datatime, numeric, image etc.) and edit the data using this form.
It allows only RDBMS (MS Acess, Oracle, MySQL, PostgreSQL, SQL-Server etc.) to create, read, update and delete data. NoSQL database systems currently are not supported.
Dashboards

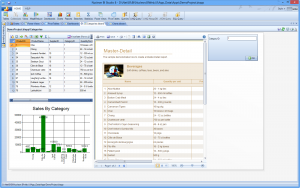
BI Studio provides an easy to use dashboard designer and powerful dashboard components. Explore your data quickly: Build visualizations with an intuitive UI and rich components.
Deliver complex information with dashboards: Translate information from your various corporate systems and data into visually rich presentations using reports, maps, charts, and other graphical elements to show multiple results together.
Reports

The reporting module is a key capability within Nucleon BI, a single product that provides complete business intelligence reporting capabilities on a proven and modern architecture. It enables you to design queries, create flexible and feature rich data reports, charts, data-grids and cross tables. The reports can be easily exported to MS Excel, Word, Open Office, PDF, XPS, XML, HTML, CSV and Image formats.
Charts
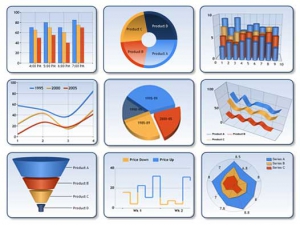
 BI Studio provides powerful and rich charting components for data visualization and visual chart designer. It supports both, 2D and 3D charting and line, spline, area, pie, point, bubble, stock and float bar chart types. An unlimited number of chart areas, titles, legends, and annotations as well as data series and data points are possible. The charting component moreover supports data copying, merging, splitting, sorting, searching, grouping, and filtering.
Web Visualization

Today Web technologies give us the option to visualize with powerful components. Nucleon BI is able to render and visualize Web pages which include HTML, CSS and JavaScript code. It allows to design and to bind data using binding technology to the Web components like table, list, image and other HTML Elements.
Data Binding
With binding technlogy you are able to bind your data to the html components and visualize on the desktop and web.
Cross Tables
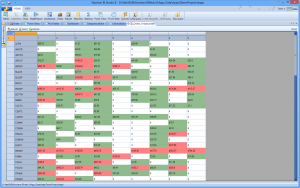
 Nucleon BI provides OLAP Cross Table features for easy visual data mining and analysis: The Cross Table module provides MS Excel-like tables (Pivot Table), engineered for multi-dimensional data analysis and cross-tab report generation. Cross Table has the power to visualize hard to read and difficult to dissect dataset information into compact and summarized visual reports.
Nucleon BizApp Studio Main Features
- Multiple Database Connections
- Data Editor Forms
- Data Source Explorer: View and Export Tables, Views or Collections.
- DataSets: Build SQL and JSON Queries for Data source
- Reports: Advanced Reporting Designer and Viewer
- Charts: Chart Designer and Viewer
- Web Visualization: Designer and Viewer for Web Pages with HTML, CSS and JavaScript
- Dashboards: Dashboard Designer and Viewer
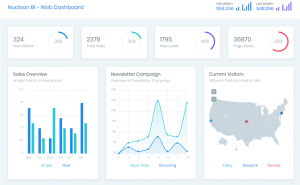
- Web Dashboards : Design and View web based dashboards
- Cross Tables: Design and View Cross (Pivot) Tables
- Power Views: Design and View Custom Data View
- Data Search: Advanced Search and Data Mining
- Scripting: Advanced .Net based C# Scripting with LINQ Support
- Atomic: .Net based Map&Reduce Framework and Computing
- Ad-Hoc Query: SQL and MongoDB Query Editors with .Net Extensions
- R Statistics: R Software for Statistics and Data Science
- Data Visualization: Text, Chart, Image and Web Visualization
- Data Export: Export Data to XML, CSV, HTML, HTML5, MS Excel, MS Word, OpenOffice, PDF, XPS, JSON, SQLite, MS Access file formats
- Data Import: SQL, CSV and XML Data Import, Data Import from other database systems
- Data Package: Export/Import Data Packages
- Data View: Data Table, Tree, XML, JSON and HTML View
Supported Data Sources
- Esri GeoDB (FileGDB, PersonalGDB, Oracle, SQLServer, DB2, Informix, PostgreSQL)
- MongoDB 2.6 or higher
- NuoDB 1.0 or higher
- ArangoDB 1.0 or higher
- Couchbase 1.0 or higher
- Amazon Redshift
- IBM DB2, IBM Informix, IBM Netezza
- Ingres 9 and higher
- Oracle 8 or higher
- MS SQL Server, MS SSAS, SQL Server CE
- Azure SQL and Azure CosmosDB
- MySQL 4 or higher
- PostgreSQL 8 or higher
- FireBird 1.5 or higher
- SQLite Database
- MS Access Database
- Microsoft Excel and FoxPro Connections
- OData v2.0, v3.0, v4.0
- ODBC and OleDB Connections
- dBASE, IBM Lotus Notes, Pradox, CSV, Simple Text and XML Files
- Apache Hive, Apache Cassandra
- SharePoint, Esri ShapeFile, XML, Json, Rest API
- ESRI GeoDB and ESRI ShapeFile
- AutoCAD® Plant 3D and AutoCAD P&ID Database
- WebDBBridge to connect remote database
- WebDbProxy to connect a data source
- Google Analytics
- Google BiqQuery
- Redis DB
